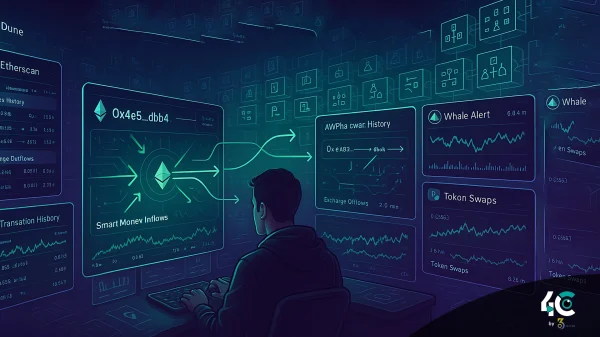
On-chain trading data is becoming essential for making better market decisions, giving traders real-time insights into blockchain trends and activity.
What Is On-Chain Data?
On-chain data is everything that shows up on a blockchain. This information includes transactions, wallet addresses, smart contract interaction, and network activity. Off-chain data, such as social media sentiment or exchange order books, may not be as reliable as on-chain data. An objective view on what’s happening on a blockchain network can be deciphered from on-chain data, as it is immutable and verifiable.
Key sources of on-chain data include
- Transaction History: Information on asset transfers between wallets.
- Understanding of ownership, investments and outflow, and large transactions (whale movements).
- The system provides information about available network metrics, used gas fees, hashing power, and staking activity.
- Data from dApps that act as logs when event triggers take place.
By looking through this dataset, traders spot opportunities and risks that might not show through normal technical or fundamental analysis alone.
How On-Chain Data Enhances Trading Decisions
1. Identifying Market Trends
- On-chain data helps traders understand the supply and demand on the blockchain. For example.
- Active addresses indicate a positive trend in the adoption of a particular asset. It may indicate address or user growth.
- Transaction Volume: A rise in transaction volumes indicates increased activity, which in turn reflects price action.
In early 2024, on-chain analytics firm Glassnode reported a surge in Bitcoin active addresses coinciding with institutional buying pressure. By tracking this trend, traders were able to front-run a big buying move.
2. Tracking Whale Movements
Big investors in crypto, dubbed “whales,” can change the price of the asset when they buy or dump a huge stash. Tools that run on chains, for example, Nansen, Santiment, and Dune Analytics, allow traders to track whale activity by monitoring wallet balances and transfer patterns.
For instance
- An outflow from centralized exchanges can indicate that whales are preparing to HODL.
- Huge deposits to exchanges could mean selling pressure.
In 2023, during the summer, thousands of whales transferred billions worth of Ethereum onto centralized exchanges just before a major regulatory announcement, which caused retail panic selling. Traders with on-chain insight avoided losses from this by leaving the position early to minimize the impact.
3. Analyzing Supply Distribution
Knowing where these tokens go will help the traders see how stable the market is. The Gini coefficient and other similar metrics tell us how rich or poor the network is, while supply distribution shows us whether the coins are concentrated or widely spread.
Example: If a new memecoin has a high Gini coefficient, it may be prone to manipulation, so trade carefully. On the other hand, a well-distributed token could show better market health.
4. Monitoring Network Health
- Indicators of Network Health Suggest a Blockchain’s Strength and Stability. Key metrics include transaction volume, node count, and hash rate.
- A higher hash rate may indicate a healthier coin.
- More and more people are participating in staking because they are confident in the future of the network.
- When gas fees are high, it indicates congestion, which can suggest peak activity time.
Traders monitoring network data suffered losses during the Solana network outage in late 2023 due to a spike in failed transactions and declining validator participation. Quick action prevented losses associated with later volatility.
5. Detecting Divergences Between Price and Fundamentals
Price action doesn’t always reflect the fundamentals. Design by the Joker 13 words
On-chain data indicates when perceived value exceeds actual usage.
For example.
- If a coin’s price goes up despite a fall in active addresses and transaction counts, then it may indicate unsustainable speculation.
- On the other hand, undervalued assets with strong on-chain fundamentals could be a buying opportunity.
Real-World Applications of On-Chain Analysis.
Spotting Accumulation Zones
Traders use the Exchange Net Flow (difference between deposits and withdrawals) as an indicator of accumulation zones where the institutions or whales quietly accumulate the token. Negative net flow indicates that more money is leaving the exchanges than is coming into them, suggesting accumulation.
For instance, the price of the Avalanche’s AVAX token increased by almost 17% in Q4 2024, following consistent outflows from exchanges and increased staking activity.
Timing Market Bottoms
Measures like SOPR help traders find the bottom of the market. When a coin is at a profit, we say it’s SOPR > 1. A drop in SOPR below 1 indicates that many people are selling at a loss, which often means capitulation and a bottom.
Bitcoin’s SOPR dipped below 1 in January 2025. Many traders believed that this was the time to capitulate. They took up positions near the cycle low and made good profits as prices rose.
Evaluating Project Viability
More and more investors are using on-chain data to assess new projects’ legitimacy. Indicators like developer activity, contract deployments, and user retention reveal information about project sustainability.
For instance, falling developer contributions and a reduction in user engagement were signs of the collapse of Terra Classic in 2022. Those traders who used on-chain indicators liquidated their positions ahead of the crash.
Challenges and Limitations of On-Chain Data
Chain information offers unmatched transparency, but it also poses problems.
- Interpreting raw data correctly requires the help of a pro. Misreading signals can lead to poor decisions.
- Users are using privacy-enhancing techniques like mixers or shielded pools to cloak their transaction details.
- Some numbers, like transaction volume, might fall behind prices, so they don’t really help predict anything.
- Focusing just on on chain information without considering other macro-market issues could cause tunnel vision.
To avoid these problems, traders should combine on-chain studies with other research factors such as technical analysis, sentiment tracking, and macroeconomic assessment.
Tools and Platforms for On-Chain Data Analysis
Several platforms have sprung up to simplify access to on-chain data.
- Glassnode provides advanced analytics and visualizations for Bitcoin, Ethereum, and other major chains.
- Nansen tracks wallet marks, DeFi activities, and NFT trends to provide actionable information.
- Santiment looks at social sentiment, development activity, and on-chain metrics.
Dune Analytics lets users craft unique dashboards and queries for tailored insights.
The Future of On-Chain Data in Trading
As blockchain technology becomes more advanced, on-chain data will be more important. Emerging trends include.
- In the future, algorithms based on machine learning will improve pronounced pattern and anomaly detection in on-chain data.
- Tools capable of aggregating data across multiple networks will become essential as multi-chain ecosystems gain traction.
- Monitoring Illegal Activities Using on-chain data can assist regulators in tracking illicit transactions and creating trust in crypto.
Conclusion
On-chain data is a rich source of information that should not be neglected. Traders can employ the research and analysis to go beyond surface indicators and gain perspective on the crypto markets. On-chain analysis helps traders identify accumulation zones, pinpoint market bottoms, and assess whether a project is worth investing in as competition in the market increases.
However, keep in mind that a single dataset does not provide a complete picture. Successful traders use on-chain analysis along with other analytical methods. They combine various analytical methods in order to obtain a complete picture.


