Why Measure Crypto Optimism?
A speculative bubble, driven by emotional decision-making, can severely affect cryptocurrencies. When optimism gets too high, markets become vulnerable to an abrupt turnaround, as reality fails to meet expectations. When traders and analysts notice signs of over-optimism, a downturn can’t be too far away.
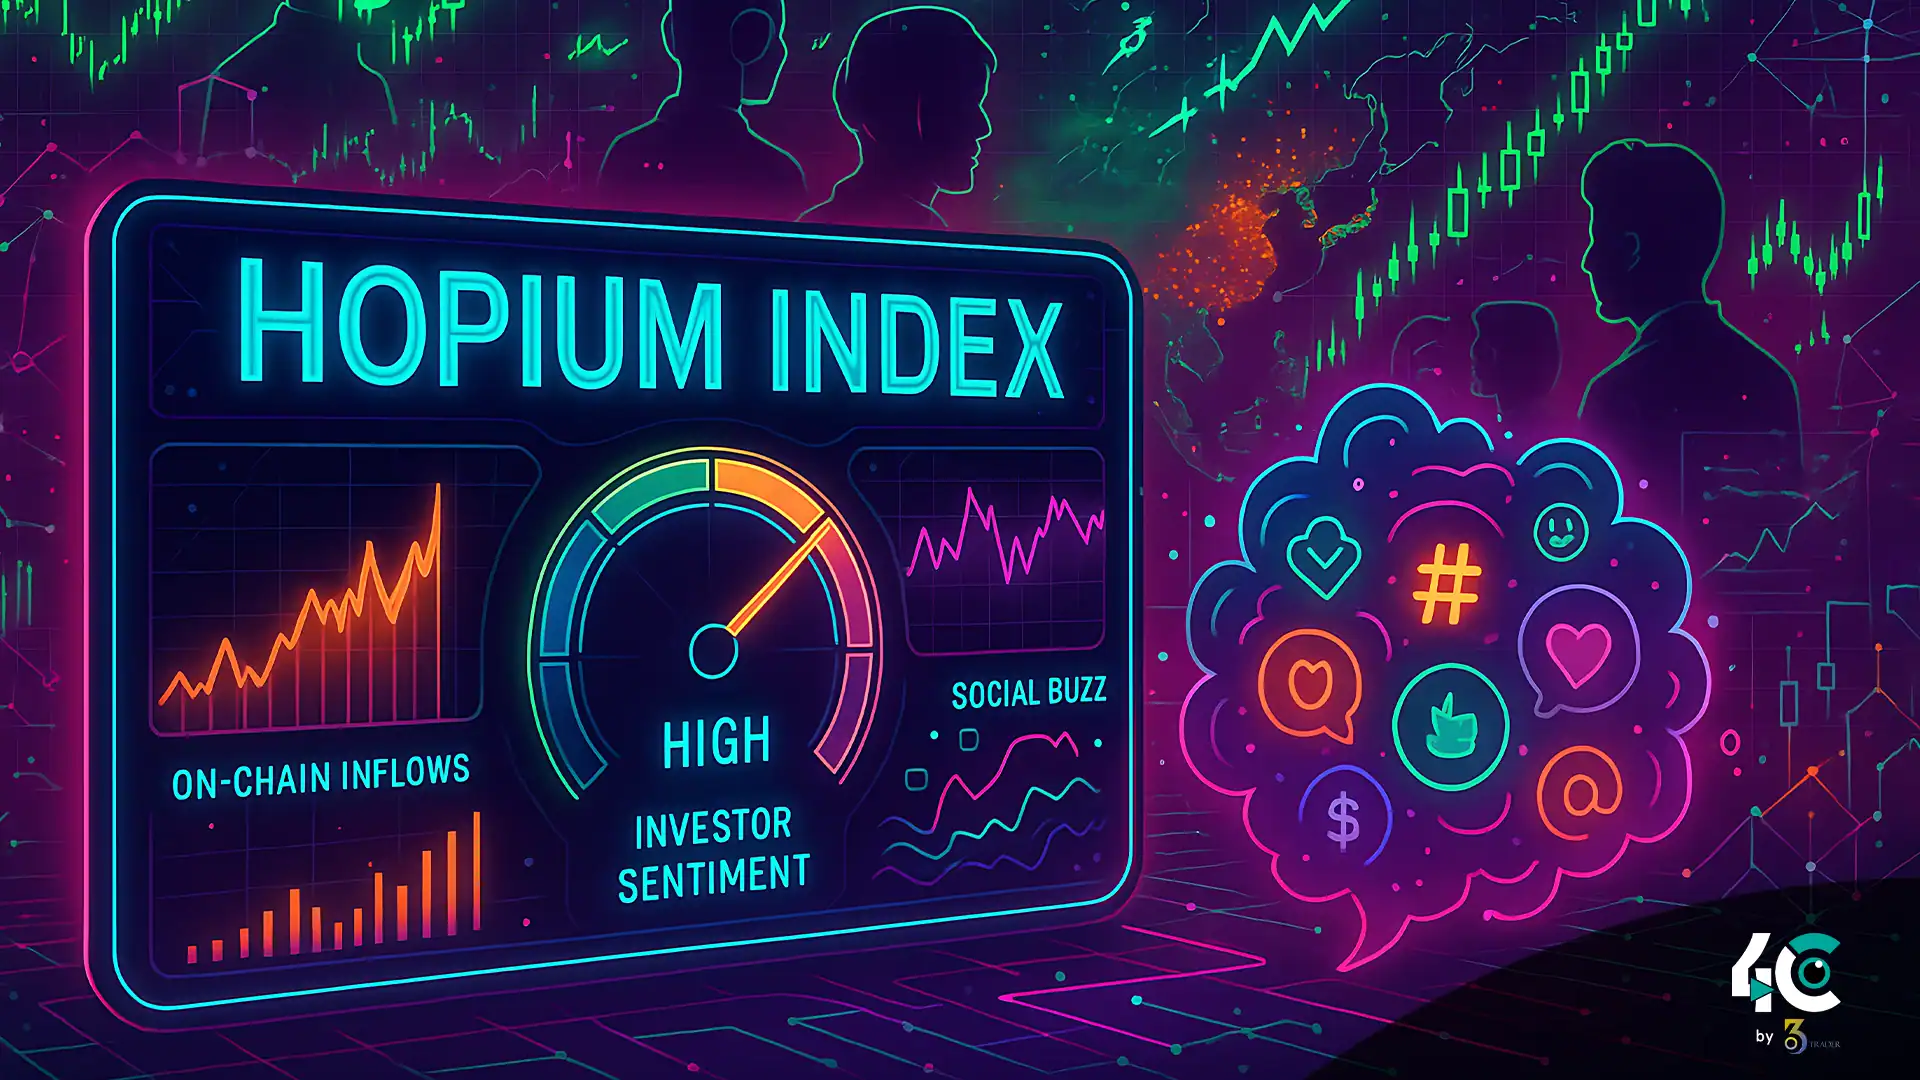
In crypto markets, sentiment analysis has no reference benchmarks, unlike other assets. The Hopium Index fills this gap by aggregating unique behavioral signaling produced in blockchain ecosystems and online communities.
Components of the Hopium Index
The Hopium Index uses three indicators to measure investor sentiment.
1. On-Chain Inflows (35% Weight)
The selling pressure on assets likely increased when investors made transfers to cryptocurrency exchanges. Yet, under circumstances of extreme optimism, investors transfer vast capital to projects, which they expect to rise, as inferred from the growing exchange deposit.
Analytics platforms based on blockchain are used here: Glassnode, Santiment, or Chainalysis (they track wallet movements and transaction volumes).
A sudden surge in inflow indicates aggressive buying, a possible sign of overconfidence.
2. Margin Positions (35% Weight)
Enhancing both the reward and the risk of a trade, margin positions now have the potential to bring huge profits as well as huge losses. The open interest and margin position can reveal whether traders are heaving bets upward or not.
Derivative exchanges Binance, Bybit, and Deribit report the funding rate, liquidation level, and leverage ratio.
We see so many people entering long positions that it could lessen the overall confidence in this trend.
3. Social Buzz (30% Weight)
X (Twitter), Reddit, and Telegram act as a real-time barometer of market sentiment and movement. By monitoring mentions, hashtags and sentiment scores, you can tell when optimism turns into hype.
Tools like LunarCrush, Google Trends, and Brandwatch analyze engagement metrics and keyword frequency.
A massive increase in positive sentiment toward niche altcoins suggests that the market could be in the late stages of FOMO.
Calculating the Hopium Index Score
We scale down each component to a range between 0 and 100, expressing its contribution to the overall optimism. The Hopium Index is calculated by weighting and combining all scores to produce the end result.
Hopium Index = (0.35 × On-Chain × Margin Positions) + (0.30 × Social Buzz)
Scoring Ranges
- Low optimism indicates either bullish or cautious market conditions.
- 31-60: Moderately Optimistic; exhibiting considerably balanced sentiment.
- 61-80: An increase in optimism and may suggest frothy behavior.
- 81-100: You’re too optimistic. You’ve got hopium overload. Substantial chance of market correction.
Here Are Examples of Past Uses of the Hopium Index
Case Study 1: When Bull Run Crashed in 2021
The price of Bitcoin shot up to more than 64,000 dollars in the month of April.
Hopium Index Analysis:
- On-Chain Inflows: Deposit inflows surged after retail investors rushed to buy new altcoins.
- Leverage ratios hit record highs as several traders used 100x+ leverage on futures contracts.
- Trending hashtags on Twitter include “Bitcoin to the Moon” and “Crypto Revolution”.
- The value of the Hopium Index reached 92, showing that many were very optimistic just days before the crash.
Case Study, 2 May TerraUSD Collapse 2022
The stablecoin TerraUSD (UST) collapsed, depleting billions in worth and triggering contagion through the market.
Hopium Index Analysis:
- Many coins were invested in UST-related protocols, indicating faith in algorithmic stablecoins.
- Traders took margin positions on LUNA, hoping it wouldn’t stop taking off.
- Social media influencers declared that Terra’s ecosystem is “the future of finance,” fueling viral adoption despite underlying vulnerabilities.
- The Hopium Index peaked at 87, signaling excessive confidence just prior to a big crash.
Applications of the Hopium Index
For Traders
Utilize the index to look for extremely optimistic periods and adjust positions accordingly.
“Unusual levels could signal contrarian buys at market bottoms (usually) or just bounces.”
For Developers
- Community health checks: Monitor the trend of sentiment to help make timely proactive fixes.
- Project launches: The timing should coincide with a decent level of optimism.
For Regulators
Market Surveillance: Monitor the Hopium Index and both known and anonymous bubbles to determine possible intervention actions.
Limitations and Challenges
1. Lagging Indicators
Some elements, like margin positions, may not alter quickly enough to reflect market changes.
2. Noise vs. Signal
Data from social media is noisy because bots and coordinated campaigns distort real sentiment. To guarantee reliability, advanced filtering techniques are essential.
3. Regional Variations
Because cryptocurrency adoption and regulations vary by country, this index will perform differently in different locations.
Conclusion: Gauging the Pulse of Crypto Markets
The Hopium Index, a new metric, aims to gauge investor sentiment in the crypto space. It uses a combination of the blockchain, derivatives, and social data. By identifying moments of optimism, the Hopium Index enhances our understanding of the unpredictable nature of digital assets.
Nonetheless, one measure cannot display all human feelings or market conditions. We recommend utilizing other tools and knowledge in context to achieve optimal results with the Hopium Index.
As cryptocurrencies continue to develop, so will the ways we investigate them and financial technologies. The Hopium Index helps us identify and manage harmful levels of optimism. It uses data to illustrate when sticking to our typical belief system causes excessive greed.
Conclusion
The Hopium Index aggregates on-chain inflows, margin positions, and social buzz to measure the level of optimism among crypto investors, all within a single index. The index accounts for the weights allotted to each component to arrive at a final score. Accordingly, “hopium overload” indicates that bullishness is excessive. It picks up on signals that may foreshadow corrections. The predictive ability of case studies from history demonstrates its effectiveness in crash forecasting applications. The usage ranges from various applications of this system to the development of risk management systems for traders, as well as regulatory surveillance. Although it has limitations due to noisy social data and geographical differences, the Hopium Index is a good tool to measure market sentiment and be aware of a possible bubble.


