In a market where every millisecond counts and sentiment swings like a pendulum, traders scour for an edge. Even though traditional technical analysis can reveal trends, on-chain analytics provides information on their causes and instigators.
Retail traders are now able to access the same insight as institutions thanks to the open blockchain data and powerful tools. Here’s how you can harness on-chain data to track smart money, anticipate market moves, and make better trades in 2025.
1. Start With the Right Tools
You don’t need to be a coder to read on-chain data. These platforms make it easy.
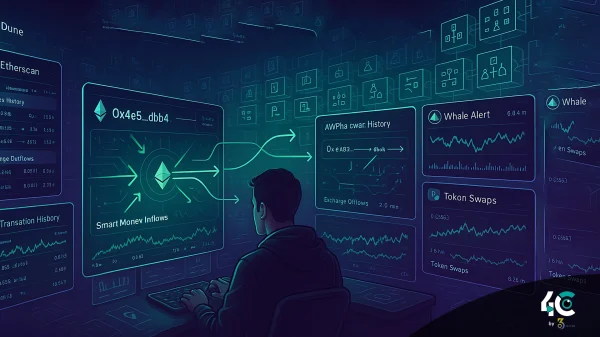
- Arkham Intelligence provides visualization of wallets with real-time labels such as Alameda, Justin Sun.
- Nansen labels wallets smart money, exchange, and airdrop hunter. It’s good for tracking fund flows.
- A Twitter based data alerts for whale moves and token launches inflow/outflows.
- Dune Analytics offers customizable dashboards for wallets, token volume, bridge flows, etc.
- DeBank lets you monitor your wallets, positions, and portfolio health in real time.
- Glassnode provides an analysis of macro on-chain indicators throughout the years.
These tools provide a visual layer on top of raw blockchain data, making it understandable for beginners as well.
2. Spotting Smart Money Before It Moves the Market
Whales differ; some consistently stance at the top while others bottom at the top. On-chain tools allow you to monitor and label those “smart wallets.”
How to find them:
- Use Nansen’s Smart Money label to identify funds, VCs, and high-performance traders.
- Look for wallets that bought into successful tokens at a low price.
- If several smart wallets are taking a low-cap token, monitor accumulation zones.
- Monitor your bridges: When ETH or stablecoin activity shows up on a new chain, this is quite possibly the starting signal for new action.
3. Case Studies: When On-Chain Predicted Events
Example One – Airdrop farming with a token surge
After bridging assets to Solana, hundreds of wallets interacted with the Jupiter testnet in anticipation of the JUP (Jupiter) token launch. Smart traders took their positions early when on-chain trackers flagged this and made outsized gains.
Example Two – A whale may exit before a token dump
Before a significant price drop in a memecoin, data from Lookonchain revealed that the top five wallets moved their tokens to exchanges. On-chain traders successfully cashed out, while retail sold the dip.
Example Three – Accumulation of Restaking Tokens
Before the EigenLayer LRT rally, EtherFi whales covertly shifted their eETH into Pendle and Curve protocols. On-chain trackers flagged the liquidity spike. Those watching benefited before Twitter caught on.
4. Beginner Tricks That Deliver Serious Alpha
You don’t need to dive deep into contracts to get started. Try these.
- Be on the lookout for where LayerZero, Wormhole, and Stargate capital is moving next!
- Monitor New Tokens and Contracts: Tools like DEXScreener and Lookonchain can help flag suspicious and/or early opportunities.
- Keep an eye on the price movements of Bitcoin, Ethereum, and stablecoins.
- Use Arkham or DeBank to set alerts on wallets of known VCs, devs, or influencers.
These tactics apply to any market type and help you foresee rather than respond.
Conclusion
Utilizing on-chain analytics, trading activity shifts from hindsight to foresight. “You’ll get an edge that only charts alone cannot provide by watching what the smart money does, the place where capital moves and how the wallets behave.”
Whether you are a novice or an expert trader, on-chain data helps you see in the dark like night vision would. In Web3, everyone has the ability to view everything due to transparency being an asset.


