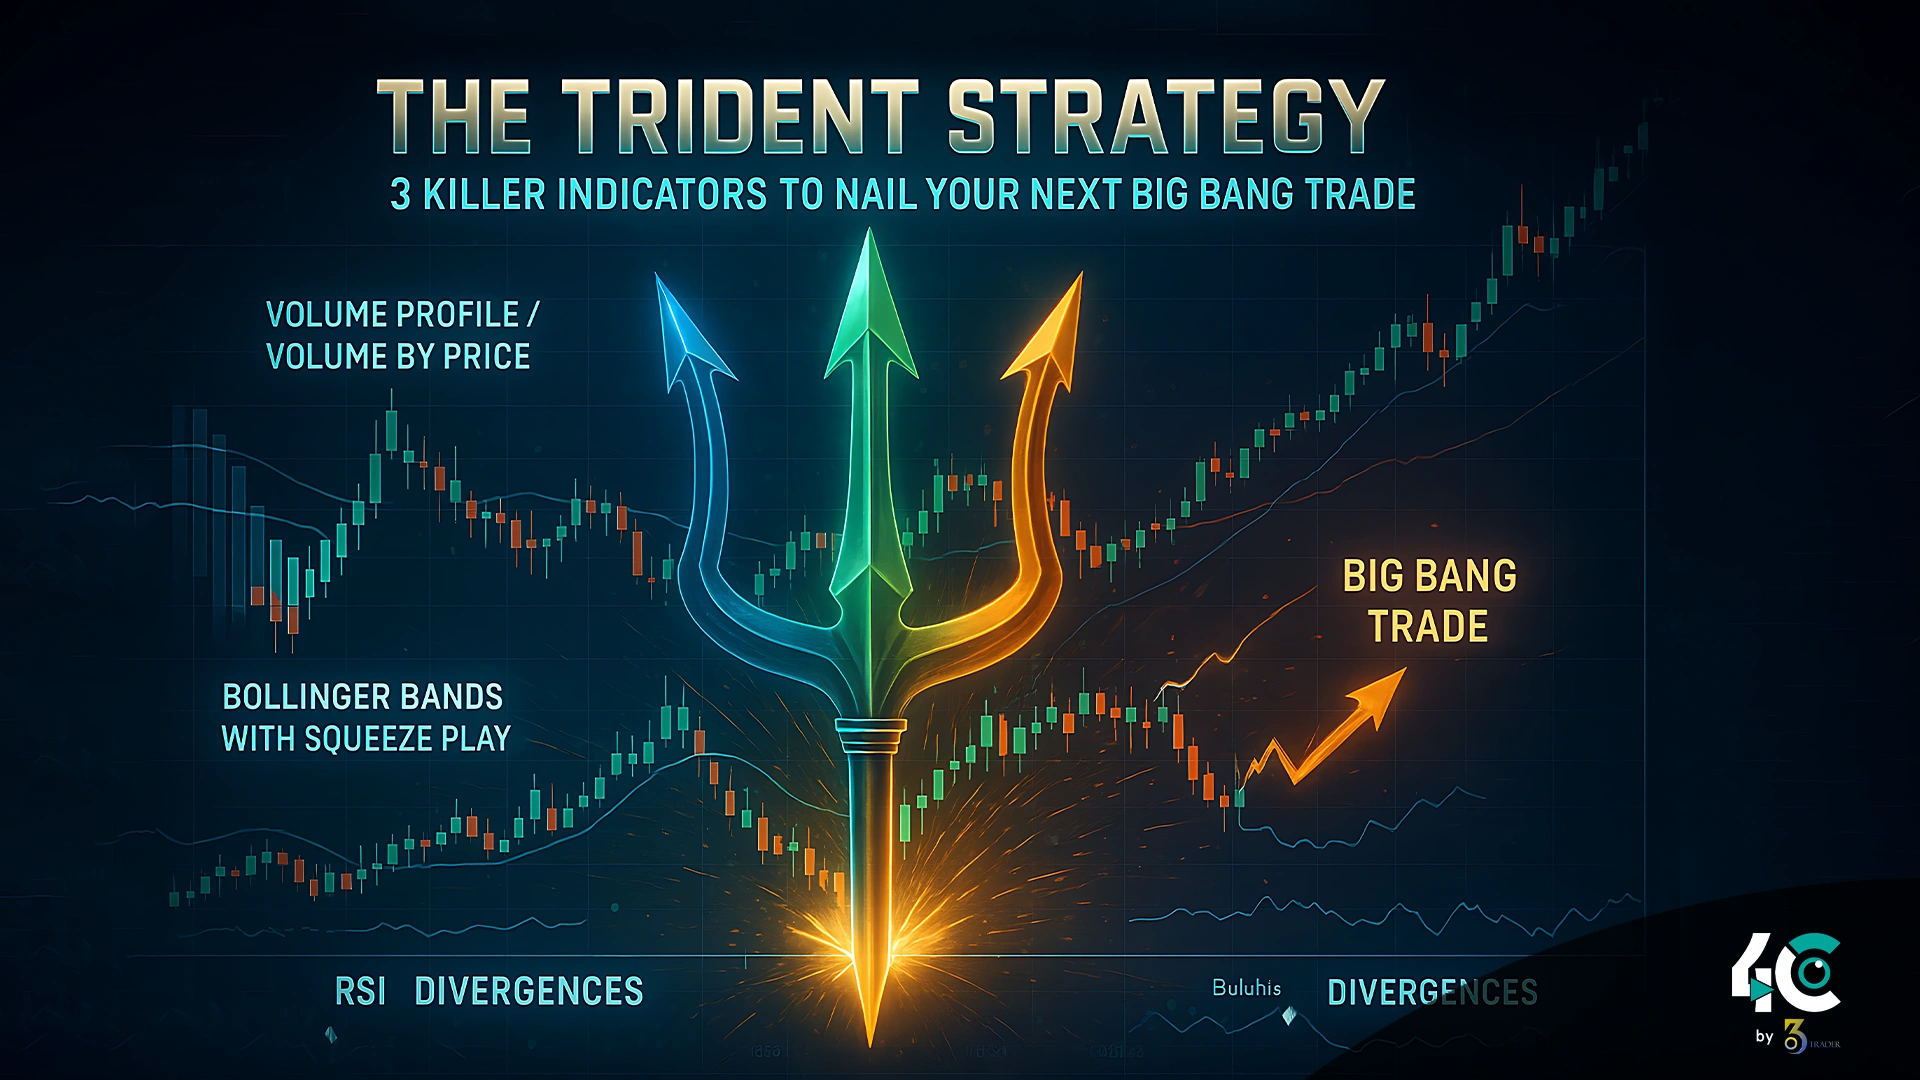
The Trident Strategy combines three powerful indicators to help traders time entries, confirm trends, and exit smartly in volatile crypto markets.
Why the Trident Strategy Works?
The Trident Strategy combines volume analysis, volatility signals, and a momentum strategy to provide a complete view of the market. Every indicator has its characteristics that give us high-probability setups.
- The volume profile is important because it highlights the area of volume concentration. As a result, it will assist you in locating important levels of support and resistance as well as liquidity.
- The high volatility squeeze that was eventually seen as leading to an explosive move in the underlying stock creates this entry indication.
- Detects overbought/oversold conditions and hidden divergences between price and momentum, signaling reversals.
When used separately, they pack a punch, but together they make for a formidable framework to execute exact trades.
1. Volume Profile Is The Foundation Of Smart Trading—Volume By Price
Traders seldom use the Volume Profile tool, but it is one of the most effective tools. It shows a graphical representation of how much of the trading activity has taken place at which price and for how much time.
Key Insights from Volume Profile
- Point of Control (POC) refers to the price level with the highest amount of trades; it is the level that price will be attracted to.
- The value area shares roughly 70% of the total volume.
- The pools of liquidity are zones that are either above price or below price. They attract large orders as they have a thin order book. In the event of a breakout or breakdown, these areas’ order books will suffer.
How to Use Volume Profile in the Trident Strategy
- Utilize the POC and value area to spot important support and resistance levels.
- After a hefty price move in the swing-low or swing-high areas, look for price retests in these zones.
- Merging volume profile with other indications (like Bollinger Bands) confirms breakout or breakdown setups.
For example, if the price breaks through the resistance of a level with strong volume behind it, then you have a bullish setup with high confidence.
2. Bollinger Bands and Squeeze Plays Timed Explosive Moves
Bollinger Bands pinpoints volatility through a series of moving average deviations. If you use it with TTM Squeeze or something similar, it will be powerful for predicting upcoming price explosions.
- Understanding Bollinger Bands and Squeeze Plays.
- Upper and lower bands serve as frequent fluctuations of support and resistance levels.
- Squeeze conditions are observed when the bands become tight around the moving average. These squeezes often precede sharp price movements.
Typically, after the squeeze resolves, the price will explode either in the direction up or down.
- The trident strategy utilizes Bollinger bands to identify squeeze plays.
- Watch out for squeezes—tightening bands indicate phases of consolidation.
- Look for a breakout above or below one of the two bands, accompanied by greater than average volume.
Combine this signal with RSI readings to ensure momentum is in the direction of the breakout.
A buy signal on TTM Squeeze along with a bullish divergence on RSI would further strengthen the argument for a long position here.
3. Relative Strength Index (RSI) With Divergences to Identify Hidden Opportunities
The RSI indicator is designed to measure the speed and change of price movements. This makes it a very useful tool for determining potential overbought and oversold situations and for spotting divergences.
Key Features of RSI with Divergences
The RSI touches either extreme and illustrates an overbought and oversold condition.
Divergences arise when the price makes a fresh high or low while the RSI doesn’t. This indicator shows weakening momentum.
Bullish Divergence: The price makes a lower low, but the RSI makes a higher low, and there can be a reversal on the upside.
Bearish divergence is when the price forms a higher high, but in the RSI, we have a lower high. So this means a bearish reversal.
How to Use RSI with Divergences in the Trident Strategy
- While prices consolidate or back, look out for discrepancies.
- Verify divergences using Volume Profile (e.g., buy where there is a liquidity zone but the divergence is bullish).
- RSI is a useful filter to avoid false breakouts and breakdowns based on Bollinger Bands.
If the price is at a good support level according to Volume Profile and there is bullish divergence on RSI, it is a good buying opportunity.
Conclusion on Trident Strategy: Masters
Developed using statistical and econometric modeling, derivative market liquidity and options pricing, the Trident Strategy has the elements of volume analysis, volatility detection and momentum assessment. With Volume Profile, Bollinger Bands + Squeeze Plays, and RSI with Divergences set up. You can easily pick high-probability setups and trade with conviction.
Remember, no strategy guarantees success. Discipline, patience, and continuing education are crucial to being successful in the markets. With enough practice, you can refine the Trident Strategy as a core part of your trading toolkit.
Conclusion
The combination of the Volume Profile, Bollinger Bands with Squeeze Plays, and RSI with Divergences is what we call the Trident Strategy. Apply a volume profile to identify major support or resistance areas. Use Bollinger Bands to time breakouts during squeezes. Use RSI to confirm reversals and divergences. Traders can use these two tools in combination to enter trades confidently with an attractive risk-reward ratio. Nonetheless, always remember risk management and avoid the usual pitfalls like overcomplicating the signals or chasing late entry.


